
By Marcelo Salamon
May 29, 2026.
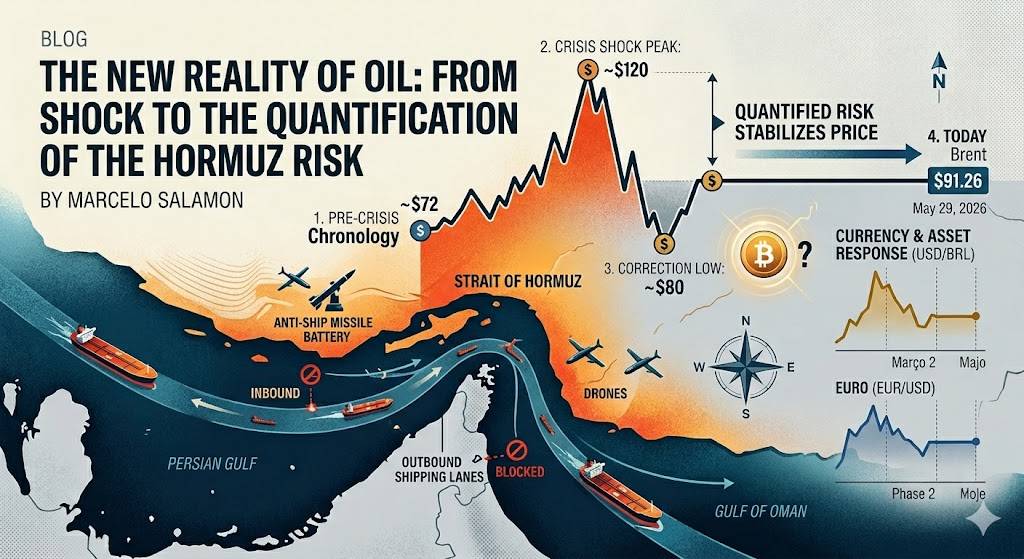
Abstract: The global energy market is undergoing a structural paradigm shift. Following the outbreak of tensions in the Persian Gulf, oil prices followed a volatile trajectory—starting from lower levels, reaching severe peaks of instability, and experiencing sharp drops before finding a steady equilibrium. This article analyzes how the “Hormuz Risk” has ceased to be an occasional uncertainty and is now a permanently quantified variable in international pricing. It demonstrates how transportation infrastructure shapes the current pricing of commodities and generates direct impacts on the behavior of the foreign exchange markets (US Dollar and Euro).
Introduction
The volatility that historically characterizes energy commodities reached a new level of complexity with recent developments in the Middle East. Sharp price movements triggered alarms across major world exchanges, leading analysts to revise classic supply and demand fundamentals. However, the stabilization observed today signals something deeper than a simple commercial truce: it is the maturity of financial markets in encoding logistical risk. The vulnerability of global maritime bottlenecks has been tested, assimilated, and finally priced by investment algorithms.
The Tactical Anatomy of Risk: Why It Is Easy to “Lock” Hormuz
To understand the new price floor, one must look beyond superficial analysis and examine the military and logistical geography of the region. The Strait of Hormuz is the most critical maritime choke point on the planet, through which approximately one-fifth of the world’s total oil consumption flows.
The technical ease with which traffic can be interrupted or severely disrupted stems from specific geographic and operational factors:
- Narrow Shipping Lanes: While the total width of the strait is about 21 miles (34 km) at its narrowest point, the usable route for Very Large Crude Carriers (VLCCs) is restricted to extremely narrow two-way shipping lanes. There is only a 2-mile wide inbound lane and a 2-mile wide outbound lane, separated by a 2-mile wide buffer zone. Any shipwreck, targeted strike, or naval mining in these lanes halts the flow immediately.
- Low-Cost Asymmetric Warfare: Modern blockades do not require a massive conventional naval fleet. Market intelligence has absorbed the fact that regional forces can freeze traffic using inexpensive asymmetric tactics: shore-based anti-ship missile batteries, low-cost suicide drones, and fast attack craft for interception.
- Lack of Alternative Routes: The pipeline infrastructure that bypasses the strait (traversing Saudi Arabia or the UAE) has a combined capacity that covers only a small fraction of the volume that passes daily by sea. If the channel closes, the oil is physically dammed.
When the market confirmed the practical feasibility of this “lock,” logistical risk ceased to be a theoretical textbook hypothesis and became a mathematical variable in commodity asset pricing.
The Price Chronology: Four Phases of the Market
Oil price fluctuations during the conflict reveal the phases of panic, correction, and finally, the consolidation of the new market reality. Macroeconomic dynamics have divided into four distinct moments:
- The Starting Point (Pre-Crisis): Before the escalation of hostilities, the market operated under normal demand fundamentals, with oil trading at substantially lower levels within historical support ranges.
- The Peak of the Shock: As conflict broke out and threats to shipping routes became imminent, widespread fear drove futures contracts. Oil skyrocketed, hitting a critical peak of nearly $120.00 per barrel in large-scale corporate supply contracts.
- The Correction Low: After the initial shock, the absence of an immediate total closure and the rerouting of fleets caused a sharp profit-taking phase. Prices dropped significantly, testing support levels near $80.00, considered the lower bound of the wartime oscillation band.
- Today’s Stabilization (The New Reality): After the two extreme reactions—panic buying and optimistic selling—the market found an intermediate equilibrium. The price has settled resiliently around the $90.00 mark. This is the definitive stabilization: prices no longer drop to pre-crisis levels because the global balance sheet now incorporates the permanent Hormuz risk premium.
Impact on Exchanges and Currency Behavior: Dollar and Euro
Foreign exchange markets in New York (Wall Street) and Europe mirrored the energy crisis stress. The search for liquidity and safety distorted major currencies during peak tension, but they now operate in stabilization bands parallel to the new oil reality.
The table below consolidates these four historical moments with financial quotes and updated market snapshots:
| Market Phase | Oil (Brent) | US Dollar (USD/BRL) | Euro / Dollar (EUR/USD) |
| 1. Starting Point (Pre-Crisis) | ~ $72.00 | $4.85 | 1.08 |
| 2. Crisis Peak (Shock) | ~ $120.00 | $5.23 | 1.10 |
| 3. Correction Low | ~ $80.00 | $4.92 | 1.12 |
| 4. Today (May 29, 2026) | $91.26 | $5.03 | 1.16 |
The behavior of the foreign exchange market shows that at the height of the conflict (Phase 2), the dollar surged globally as a safe-haven asset, hitting $5.23 in the commercial market. In Europe, energy dependence created complex currency pressures. Today, with oil consolidated in an intermediate band of $91.26, the exchange rates have settled: the commercial dollar trades steadily at $5.03, while the Euro-to-Dollar parity holds at 1.16, proving that commercial trade flows have fully absorbed the new logistical cost of energy.
Conclusion
The stabilization of oil prices at an intermediate level does not mean the crisis has vanished, but rather that the market has learned to quantify it. The maritime transport mechanism and the military geography of the Strait of Hormuz have been permanently integrated into global asset pricing models. For commodity investors, FX traders, and analysts of decentralized markets like Bitcoin, the lesson is clear: geopolitical risk is no longer an unpredictable surprise; it is a coded fixed cost in the global economy.
References
- Bloomberg Markets. (2026). Currency Volatility and the Geopolitical Risk Premium in 2026. Bloomberg L.P.
- Investing.com. (2026). Global Oil Price Index and Brent Crude Futures Historical Data. Financial Market Data.
- Reuters Business. (2026). The “Hormuz Lock”: Logistical Constraints and Energy Security. Thomson Reuters.
- U.S. Energy Information Administration (EIA). (2026). World Oil Transit Chokepoints: Strait of Hormuz Analysis. U.S. Department of Energy.
