
By Marcelo Salamon
july 19, 2026.
Abstract
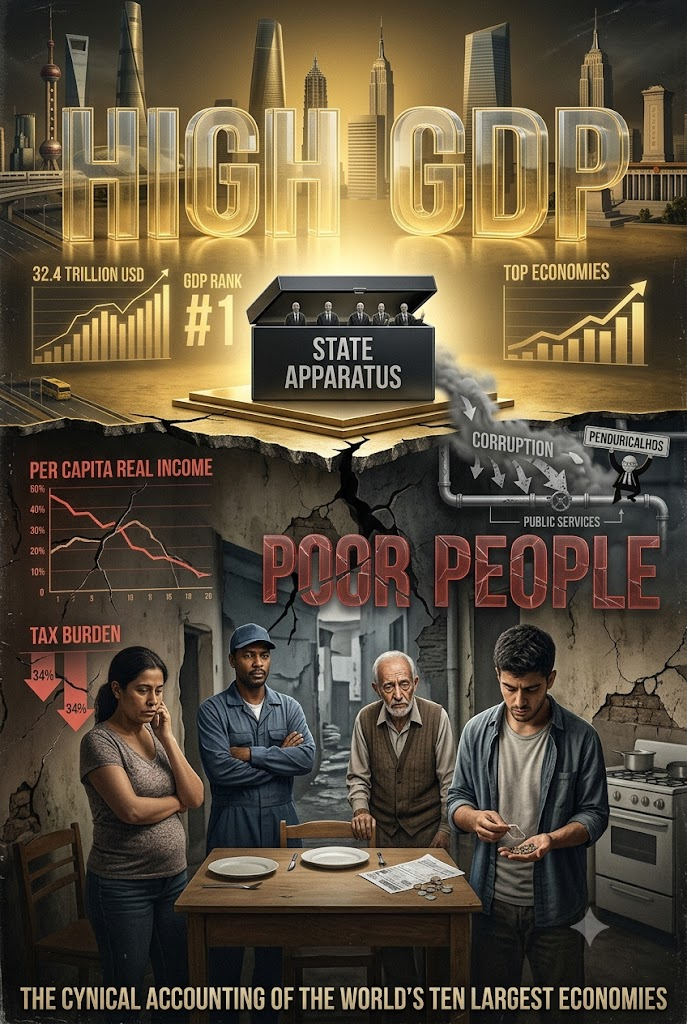
This article cross-references data from the International Monetary Fund, Transparency International, and national fiscal institutes to expose an uncomfortable discrepancy between the nominal size of the planet’s ten largest economies and what actually reaches the pockets—and the quality of life—of their populations. The guiding question of this analysis is simple yet unsettling: Does a high GDP signify a wealthy populace, or merely a massive state apparatus? By comparing total GDP rankings, GDP per capita, tax burdens, and corruption perception indices, this paper identifies which countries deliver coherence between revenue collection and societal return, and which operate, in practice, as rent-extraction mechanisms benefiting administrative and political elites. Cases such as the Brazilian judiciary—the highest paid in the world relative to national average income—serve as a case study for a phenomenon repeated, with regional variations, from the Kremlin to Brasília.
Keywords: economic inequality; tax burden; institutional corruption
Introduction
Every time a government announces that its nation has “moved up in the global GDP rankings,” the press celebrates as if it were synonymous with a wealthier population. It is not. GDP measures the total size of an economy—it says nothing about who keeps the money, how much the state extracts before anything reaches the citizen’s table, or how effectively that state returns what it took in taxes through public services.
This article analyzes the world’s ten largest economies by nominal GDP in 2026—the United States, China, Germany, Japan, the United Kingdom, India, France, Italy, Russia, and Brazil—and asks the question that official press releases systematically avoid: Does this economic scale translate into a compatible per capita income? Is the tax burden justified by the return in public services? And, comparing published corruption metrics against what public perception and recurring scandals suggest, who is lying—the indices or institutional government marketing?
There is no attempt here to sound balanced merely for the sake of balance. Some countries on this list possess fiscal and political mechanisms that are structurally more honest with their citizens than others. Meanwhile, there are nations—Brazil among them, though far from unique—where the chasm between official discourse and the reality of those paying the bills is staggering.
The Snapshot: GDP, Per Capita Income, and Corruption Side by Side
The table below cross-references nominal GDP (International Monetary Fund, 2026 projection), relative global ranking for GDP per capita, and scores from Transparency International’s 2025 Corruption Perceptions Index (CPI), scored from 0 (highly corrupt) to 100 (very clean) across 182 evaluated countries.
| Country | Nominal GDP ($ Trillion) | GDP Rank | Approx. Per Capita GDP ($) | 2025 CPI Score | CPI Rank |
| United States | $32.4 | 1st | ~$89,000 | 64 | ~28th |
| China | $20.9 | 2nd | ~$14,800 | 43 | 76th |
| Germany | $5.5 | 3rd | ~$65,000 | 77 | 10th |
| Japan | $4.4 | 4th | ~$34,000 | 71 | 18th |
| United Kingdom | $4.3 | 5th | ~$55,000 | 70 | 20th |
| India | $4.2 | 6th | ~$2,700 | 39 | 91st |
| France | $3.6 | 7th | ~$46,000 | 66 | 27th |
| Italy | $2.7 | 8th | ~$40,000 | 53 | 52nd |
| Russia | $2.1 | 9th | ~$14,200 | 22 | 157th |
| Brazil | $2.3–$2.6 | 10th | ~$11,000 | 35 | 107th |
Note: Approximate per capita values modeled from IMF and World Bank projections. This data reflects orders of magnitude rather than cent-precision to highlight disparities rather than decimal points. All dollar values represent USD.
The initial breakdown is telling. Germany, despite holding the 3rd spot in absolute GDP, boasts a per capita income over double that of several peers relative to its scale, coupled with a corruption score that places it among the top ten cleanest nations. It represents a coherent system: a massive economy with broad population benefits and highly reliable institutions.
At the opposite extreme, Russia presents the most striking dissonance between raw economic power and societal return: the 9th largest GDP globally, yet ranking 157th in corruption perception—faring significantly worse than most evaluated nations, including far smaller economies. It is a state extracting revenue at a global superpower scale while delivering transparency akin to a failed state.
The Chinese Case: The World’s Factory Does Not Share the Factory
China serves as a premier example of a monumental GDP coexisting with a mediocre per capita income. Holding the second-largest economy, China’s per capita GDP hovers around one-sixth of the American average, despite its absolute economic volume reaching nearly two-thirds of the United States.
This is no demographic accident; it is a structural model choice. Decades of growth were built on subsidized exports, cheap labor, and massive state reinvestment in infrastructure and heavy industry, rather than wealth transfers to the final consumer. Its CPI score of 43 (76th place) also directly contradicts the image of hyper-efficient technocracy Beijing projects globally, suggesting a state apparatus where the line between political authority and private enrichment remains porous, despite frequent and highly publicized anti-corruption campaigns.
India: An Engine That Grows But Does Not Distribute
India, advancing rapidly in total GDP rankings and challenging Asian leadership in expansion pace, offers a raw depiction of the split between economic scale and citizen reality. With a per capita GDP of only a few thousand dollars—the lowest among the top ten by a wide margin—and a CPI score of 39, the nation demonstrates that volume growth is fundamentally distinct from wealth distribution. A giant’s GDP coexists with hundreds of millions of people entirely outside any consistent social safety net.
The United States: Coherence with Caveats
The United States remains the nation with the largest single GDP and one of the highest per capita incomes on the list. The American tax burden, historically hovering around 24–25% of GDP, is among the lowest in developed economies, reflecting a state that delivers fewer public safety nets (such as universal healthcare) in exchange for lower fiscal extraction.
However, its CPI score of 64 indicates a steady decline in institutional integrity perception in recent years. This is driven by political-financial capture, unregulated lobbying, and a campaign finance framework that normalizes activities labeled as outright influence peddling in other developed jurisdictions.
Western Europe: The Social Contract (Still) Working—With Fissures
Germany, France, and the United Kingdom carry the heaviest tax burdens on the list: France leads at approximately 45% of GDP, Germany revolves around 37–39%, and the United Kingdom approaches 35%. These are large, expensive states that extract heavily.
The difference between them and nations like Brazil or Russia is that these European states generally return that revenue via measurable health, education, and infrastructure services, justifying relatively solid corruption scores (77, 66, and 70, respectively) and robust per capita incomes. However, they are not immune to critique: France faces continuous erosion in institutional trust, and Italy—with a tax burden around 42% and a CPI score of just 53—stands as an internal counterexample, taxing like a Nordic state while delivering institutional integrity closer to an emerging market.
Japan: High Integrity, Low Dynamism
Japan presents a rare combination: an exceptional CPI score of 71, yet a per capita income that remains relatively constrained for a highly developed economy. This reflects decades of stagnation, an aging population, and a labor market highly resistant to structural reform. It demonstrates that institutional integrity, while a necessary condition for broad prosperity, is not a sufficient one on its own to spark economic dynamism.
Brazil: The Ultimate Lesson in Fiscal Incoherence
We arrive at the nation driving the core inquiry of this analysis. Brazil extracts between 32% and 34% of its GDP in taxes according to the National Treasury and research institutes like the IBPT—a burden comparable to Germany and the United Kingdom, both highly developed welfare states. Yet, what does Brazil return? It holds a CPI score of 35, placing 107th out of 182 nations—marking its worst historical sequence since entering the evaluation in 2012. Its per capita GDP does not reach one-fifth of the American average. Human development indicators show that Brazil ranks among the worst countries at converting tax revenue into societal welfare, lagging behind nations with similar nominal tax rates.
The most visible symptom of this issue is the judiciary. No other country in the world compensates its magistracy with salaries and extra benefits (“penduricalhos”) so profoundly disproportionate to the population’s average income. Housing allowances, food stipends, compensatory payments, and various bonuses push judicial paychecks to multiples of the national per capita income, all while the public perception of judicial efficiency remains among the worst globally. While Italy and Russia also suffer from expensive, unresponsive state mechanisms, Brazil combines the worst of both worlds: a rich-country tax burden with a poor-country return, alongside a top-tier public echelon fully shielded from accountability via special legal forums and extreme job stability.
This elite bureaucracy—judges, prosecutors, and legislative officials—is not an isolated exception. It represents a state structure that established an internal class taxing the population like a Nordic country and compensating itself like a Nordic country, without delivering Nordic-quality services to the rest of society.
Russia: A Superpower Facade Built on an Extractive Base
Russia concludes the list with the worst corruption rating among the top ten economies: 22 points, 157th place globally. This marks the most shocking gap between raw economic power (9th largest global GDP) and institutional integrity.
A state combining a wartime economy, reliance on energy commodities, and extreme political centralization structurally converts national wealth into private assets for an elite close to the regime rather than distributed per capita income. The Russian score is the predictable outcome of a system where checks and balances have been systematically dismantled.
Where Does the Money Go?
The pattern emerging from this side-by-side analysis of the top ten economies is stark. Where a high tax burden is paired with a high integrity score (Germany, France, United Kingdom), the general population receives tangible public returns. Where a heavy tax burden meets a low integrity score (with Brazil as a premier example and Russia pushing the dysfunction even further), wealth evaporates between the taxpayer’s pocket and the promised public service. It is absorbed by an oversized state machinery, elite tiers, or procurement networks serving a select few.
The fundamental question is not “how much does the state tax,” but “who keeps what the state collects.” Top-tier public salaries disconnected from average wages, benefits bypassing constitutional caps through “compensatory” labels, and politicians shielding their own pay and immunity through self-approved mechanisms constitute the common thread linking the Brazilian judiciary, Russian oligarchs, and the private-finance-captured political class of the United States. The institutional framing changes; the extractive logic remains identical.
Conclusion
A high GDP does not guarantee a wealthy population, and an elevated tax burden does not guarantee a functional state. The comparison among the world’s ten largest economies shows that the variable dividing functional countries from those that merely simulate functionality is not the size of the economy. It is the distance between what the state collects and what it returns, paired with the integrity of the institutions managing that bridge.
Germany, Japan, and the United Kingdom prove that it is possible to tax heavily and deliver returns. Russia and Brazil demonstrate the opposite: states that learned to tax like wealthy nations while acting like captured systems when held accountable. As long as public debate remains trapped in the empty metric of “we are the Xth largest economy,” without asking who pockets that wealth, citizens will continue to fund a social contract that was never fulfilled.
References
- CM Capital. (2026). The World’s Largest Economies: Updated 2026 Ranking. Nominal GDP dataset by country.
- IBPT (Brazilian Institute of Planning and Taxation). (2025–2026). Society Welfare Return Index (IRBES). Curitiba, Brazil.
- International Monetary Fund (IMF). (2026). World Economic Outlook (April and June 2026 Updates). Nominal GDP and GDP per capita database. Washington, D.C.
- National Treasury of Brazil. (2025). Gross Tax Burden Analysis (March 2025 Report). Brasília, DF.
- OECD. (2025). Revenue Statistics: Comparative Tax Burden Across Member Countries and Emerging Partners. OECD Publishing, Paris.
- Trading Economics. (2025). Historical Series: Corruption Index and Global Rankings by Country (December 2025 Dataset).
- Transparency International. (2026). Corruption Perceptions Index (CPI) 2025. Berlin, Germany.
- Transparency International Brazil & Transparency International Portugal. (2026). National Deep-Dive and Regional Case Studies on the 2025 CPI.
